A Step-by-Step Guide to Advanced Data Visualization in Power BI

Advanced Data Visualization in Power BI, Impact Reporting

Are you ready to take your impact reporting to the next level? Nonprofits that are ready to grow use data visualization to track trends, analyze related data, tell their stories, and build support for their movements. Did you know that one of the most powerful tools out there is also free? Microsoft Power BI is an enterprise level tool that large corporations use to help them grow, and in this article, we are going to help you learn how to use it. This step-by-step tutorial will guide you through building a comprehensive financial report from start to finish.

Step 1: Import Your Data

We need to start by importing a data source. This is going to take the information you need to analyze and put it into the software. To help us work together, we have included a sample file for you.

  1. Download Power BI: Click this link, and follow the installation instructions. 
  2. Download this file:  Financials XLSX.
  3. Open Power BI: Launch Power BI Desktop.
  4. Import Data:
    • Click on Get Data.
    • Choose Excel as the data source.
    • Import the “Financials.xlsx” file into Power BI.

Step 2: Prepare Your Data

Next, we are going to use Power Query to turn the Financials spreadsheet into different “tables” for the Data Model. Power Query is a powerful ETL tool and comes packages within the Power BI Software. These are what Power BI will use to perform deep analysis by organizing data into different segments, making up our data model.

  1. Load Data into Power Query:
    • Select the “Financials” sheet to load.
    • Remove any unnecessary sheets or extra columns.
  2. Create a Segment Table:
    • Duplicate the “Financials” table.
    • Keep only the column the “Segment” Column
      1. Right click Column “Segment”
      2. Select “Remove other columns”
  3. Create a Country Table:
    • Duplicate the “Financials” table again.
    • Retain only the “Country” Column
      1. Right click Column “Country”
      2. Select “Remove other columns”
  4. Create a Calendar Table:
    • Use the reference from the original data file to create a Calendar table.
      1. Select Calendar Table File
      2. Copy contents – select all + Copy
Advanced Data Visualization in Power BI, Impact Reporting

c. Go to Power Query (“Transform data”)

d. Click “New Source”>”Blank Query”

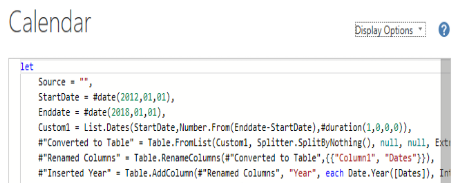
e. Open “Advanced Editor”

f. Select all and paste over contents

g. Change the dates to reflect the dataset. The format is yyyy,mm,dd. Always add a leading zero for any number below 10. 

h. StartDate = #date(2012,01,01) 

i. Enddate = #date(2018,01,01)

j. Click Done

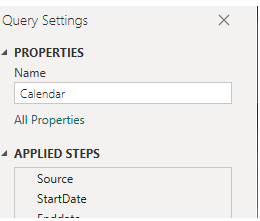
k. Rename the file to Calendar

Advanced Data Visualization in Power BI, Impact Reporting


     5. Select Close and Apply

     6. You’re now in report view

Step 3: Build the Data Model

Now comes the data model. This is where we connect our tables together. You can think of this as the wires inside an appliance. Everybody else will see the outside, but you need the inside to make it work.

  1. Set Calendar as Date Table:
    • Right-click the Calendar table.This contains the dates used in the date range of the report.
    • Select Mark as Date Table and confirm. Establish Relationships:
    • Link the Calendar table to the Financials table by connecting the Date columns. 
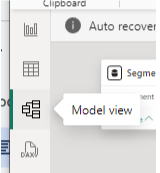
      1. Open the Model view
Advanced Data Visualization in Power BI, Impact Reporting

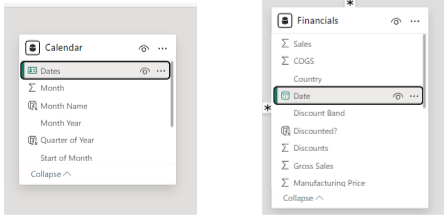
b. From the calendar Table – Click the Dates column and drag until you’ve hovered over the  Date Column in the Financials table

Advanced Data Visualization in Power BI, Impact Reporting

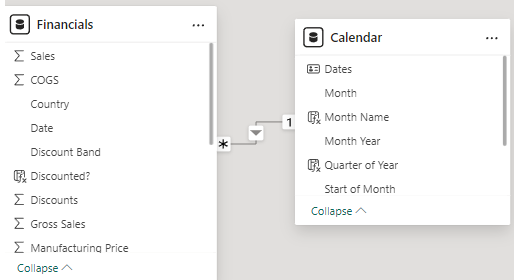
c. Once complete an arrow will appear connecting the 2 tables in the model.

Advanced Data Visualization in Power BI, Impact Reporting

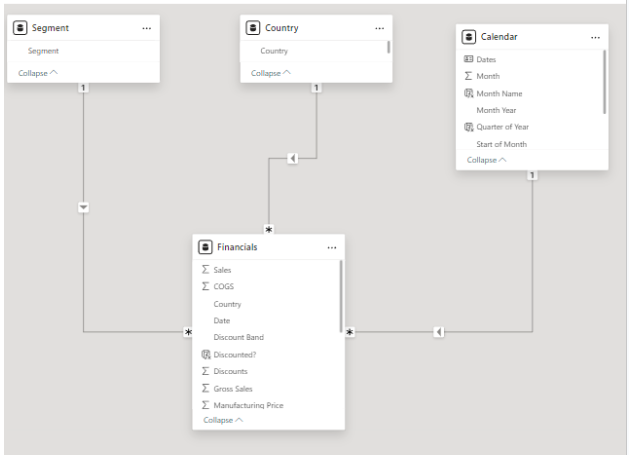
d. Verify and adjust any other relationships as necessary. Ensure there are three key relationships in your model. Reference the image below, your model should look like this.

Advanced Data Visualization in Power BI, Impact Reporting

Step 4: Create Calculated Columns

Now, we are going to add a few calculation columns to make your report more presentable and interesting. Don’t worry! We have provided the formulas for you.

  1. In the Calendar Table:
    • Right click “Calendar”, Select New Column for the following column formulas
      1. Month Name: = FORMAT([Dates], “mmmm”)
      2. WeekStart: = [Dates] – WEEKDAY(‘Calendar'[Dates], 2)
      3. Quarter of Year: = “Q” & FORMAT([Dates], “Q YYYY”)
  2. In the Financials Table:
    • Right click “Financials”, Select New Column for the following column formulas
      1. Unit Margin: = [Sale Price] – [Manufacturing Price]
      2. Discounted?: = IF([Discounts] > 0, “Y”, “N”)
  3. In the Country Table:
    • Right click “Country”, Select New Column for the following column formulas
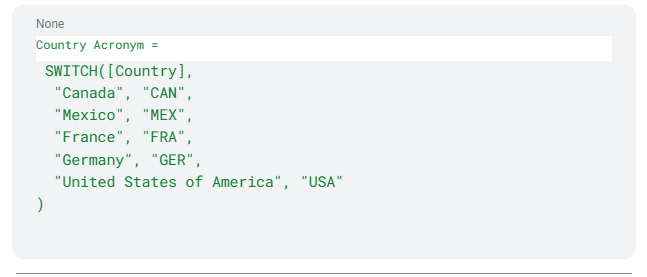
    • Country Acronym:
Advanced Data Visualization in Power BI, Impact Reporting

Step 5: Create Essential Measures

We are going to add just one more table. This table will be used to organize the measure in the report in one place. Measure are formulas in the report that are not directly contained in a table.

  1. Set Up a Measure Table:
    • Create a new table in Power BI called _Measures using the Enter Data function.
      1. Go to “Home” in the toolbar
      2. Select “Enter Data”
      3. Rename the Table in the bottom right hand corner to  “_Measures”
    • Use this table to contain all future measures
  2. Create Key Measures:
    • Right click the new “_Measures” table. Select “New Measure” for the following formulas
      1. Sum Profit: = SUM(Financials[Profit])
      2. Sum Gross Sales: = SUM(Financials[Gross Sales])
      3. Profit Margin: = [Sum Profit] / [Sum Gross Sales] * 100
      4. Profit Margin All: = CALCULATE([Profit Margin], ALL(Financials)
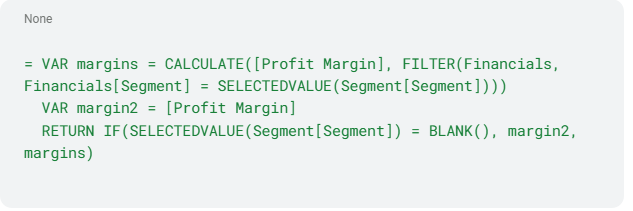
      5. Margin by Segment:
Advanced Data Visualization in Power BI, Impact Reporting

Step 6: Design the First Report Page

Now for the fun part! Time to start building your reports.

  1. Add Basic Elements:
    • Insert a Rectangle Shape (Insert>Shape>Rectangle) and expand across the top of the page
    • Add a Text Box (Insert>Text Box) and title it “Financial Report.”
  2. Include Slicers:
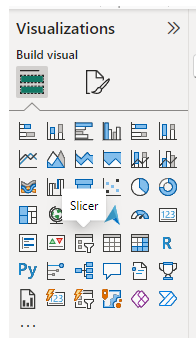
    • Add slicers for Segment, Date, and Country from the visualizations pane
Advanced Data Visualization in Power BI, Impact Reporting
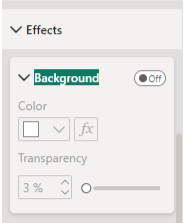
  •  Remove their background colors to maintain a clean look.

a. Under visualizations go to the second tab “Format your visual”

b. Type “Background” in the search box

c. Scroll down to effect and turn off the background by sliding the slider

Advanced Data Visualization in Power BI, Impact Reporting

 3. Insert Key Metrics Using Cards:

  • Bring in 4 cards an space evenly under the rectangle with title “Financial Report”
  • Highest Margin

a. Rename the first card “Highest Margin”

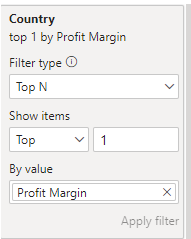
b. Select “Filters” pane and pull in the column country in the country table

c. In the first drop down apply the following settings

Advanced Data Visualization in Power BI, Impact Reporting

d. Pull in “Profit Margin” in the “By value” space.

e. Select “Apply Filter”

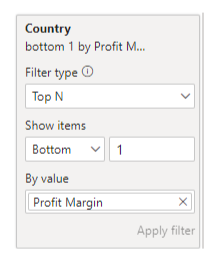
  • Lowest Margin

a. Apply the same steps as Highest Margin but select “Show items >Bottom” instead of Top and apply filter

Advanced Data Visualization in Power BI, Impact Reporting
  • Gross Sales

a. In the 3rd card pull the measure “Gross Sales” into the Fields box

  • Cost of Goods Sold (COGS)

a. In the 4th card pull in the measure “COGS”

  • Units Sold (titled “Quantity Sold”)

a. In the 5th card pull in the measure “Units Sold”

b. Right click the name and rename to “Quantity Sold”

4. Create Graphs:

  • Production Cost by Country

a. Select Clustered Column Chart and pull into report view canvas

b. Insert Country field from the country table in to the X-Axis of the field list

c. Insert Manufacturing Price from the Financials table into the Y-Axis

d. Rename Manufacturing Price to “Prod Cost”

  • Gross Sales by Country

a. Repeat steps from Production Cost by Country but the Y-Axis is Gross Sales

  • Profit Margin by Country

a. Repeat steps from Production Cost by Country but the Y-Axis is the Profit Margin Measure

  • Stacked Bar for Profit x COGS

a. Select the Stacked Column Chart and pull into the report view canvas under the production Cost visualization

b. Add Country[Country Acronym], Calendar[year], and Calendar[Quarter of Year] into the X-Axis

c. Add the Measure “Sum Profit” and Financials[COGS] to the Y-Axis

d. Right click the COGS and select “Sum” from the dropdown

  • Net Sales

a. Select the Stacked Column Chart and pull into the report view canvas under the Production Margin by Country visualization

b. Add Country[Country], Calendar[Year], Calendar[Quarter of Year], and Calendar[Dates] into the X-Axis

c. Add the Financials[Sales] field to the Y-Axis

Step 7: Duplicate and Customize Report Pages

For a truly engaging report, you probably want multiple report pages that have different views of the information depending on the audience or question you seek to answer with the data. In this case we’re creating a “Report by Segment” page so we can see the report categorized by segments.

1. Duplicate the First Page:

  • Right-click the first report page and select “Duplicate” to duplicate it.
  • Rename this page as “Report by Segment.”

2. Customize the Report:

  • Replace the Country-based fields with Segment-based data, Segment[Segment], to offer different perspectives on the financial data. Segment[Segment] should be on the X-Axis in the Clustered Columns charts and top of the X-Axis in the other charts.

3. Hide the Report by Segment Page

  • Right click the “Report By Segment” page title and select “Hide”

a. Note: You will be able to see the page while building the report but if published to Power BI online the user won’t see it unless its navigated to using a button.

Step 8: Add a Matrix for In-Depth Analysis

What makes data viz tools like Power BI more powerful than simple charts and graphs is the ability for people to interact with the data. A matrix will make it possible to really “drill down” into your data to see patterns and trends that you might not otherwise.

1. Add a report page and name it “Detail”

2. Hide the new report page

3. Insert a Matrix Visual:

  • Select Matrix from the visualizations
  • Add the following Measures as Values:

a. Gross Sales

b. Profit Margin

c. Profit Margin All

d. Sum Profit

4. Add the Following as Columns:

  • Segment

5. Set Rows to:

  • Calendar[Quarter of Year]
  • Country [Country Acronym] (rename this to “Country” for clarity)

Step 9: Format Your Report for Clarity

People stay more engaged with things that look good. So take a bit of time to format your report by doing the following:

  1. Remove Automatic Titles:
    • Select Visualization
    • Select “Format Your Visual” under visualization (brush icon)
    • Type “Title” into the search
    • Under the section called “Title” click the “On” button so it switches to “Off” and the title disappears. Repeat for all column visualizations.
  2. Adjust the number of decimal places on cards for clarity.
    • Select a card
    • Go to “Format  Your Visual” 
    • Type “Decimal” into the search
    • Under “Display Units” change “Value decimal places” to 1.
  3. Align and Distribute Elements:
    • Select each row of visuals on the page.(Shift + click each visual)
    • Select Format>Align>Distribute Horizontally
    • Repeat for each row and each page
  4. Apply a Report Theme:
    • Change the theme and adjust background transparency for a polished look.
      1. In the toolbar select “View”
      2. Select a theme under “Themes” – the example is using “Tidal”

Step 10: Enhance User Experience with Advanced Visualizations

If you are presenting your report to others, and really want to impress them, you can add some advanced navigation tools.

  1. Create Navigation Buttons:
    • Add buttons labeled “To Segment”
      1. Select “Insert” in the toolbar
      2. Click Buttons
      3. Click “Blank”
      4. Drag over the Data slicer
      5. Type in the button “To Segment”
      6. Add Action
        1. Select the “To Segment” button
        2. Under Format  Button select Action
          1. Set to “On”
          2. Type is “Page Navigation”
          3. Destination is “Report by Segment”
      7.  and “Return to Country” on relevant pages.
    • Add button on “To Country”
      1. Repeat same steps as “Add buttons labeled “To Segment” but rename to “To Country” and set Destination to “Report by Country”
  2. Test the buttons by Ctrl+Click each button to get redirected to the other page

conclusion

By following this step-by-step guide, you can build a comprehensive financial report in Power BI that transforms raw data into meaningful insights. We have shown you how to do this with a standard financial report from a business use-case. But you can adapt this for donations, program participation, events, and more! These more advanced reports will not only help you understand your nonprofit performance but also empower you to make data-driven decisions with confidence. If you have questions or need support, do not hesitate to reach out!

For personal training sessions or to answer your questions one on one please book with me below!

Picture of Quinita Whitfield

Quinita Whitfield

Quinita is seasoned Business Intelligence and Data Analytics Consultant who specializes in analytics solutions.